Bike Rental and Tour Company: Organic Traffic Nearly Doubled Year on Year
The challenge
A bike rental and guided tour company operating in several major US cities partnered with Technical Content Links in February 2021, through a tourism marketing agency partner. Each city has its own rental, tour and event pages, so the site needed to rank city by city.
With rentals, tours and events across several cities, the site had a large number of near-identical pages. Titles, descriptions and headings didn’t target each city clearly, a test subdomain was showing up in Google, and there was no structured data telling search engines what each tour or rental actually was.
Our approach
- 01
A full audit covering site
A full audit covering site structure, duplicate content, backlinks, analytics, site speed and competitors
- 02
Keyword research and mapping across
Keyword research and mapping across every city rental, tour and event page
- 03
New titles, meta descriptions and
New titles, meta descriptions and H1s rolled out city by city, with implementation checks
- 04
Technical fixes, including removing the
Technical fixes, including removing the duplicate test subdomain from search results
- 05
FAQ keyword research and FAQ
FAQ keyword research and FAQ content for each location
- 06
LocalBusiness, Product, TouristTrip and Event
LocalBusiness, Product, TouristTrip and Event schema across rental, tour and event pages
- 07
An internal linking audit, recommendations
An internal linking audit, recommendations for new service pages, and a refreshed keyword map at the end of the year
- 08
Link building to the homepage
Link building to the homepage and the core city rental pages
The results
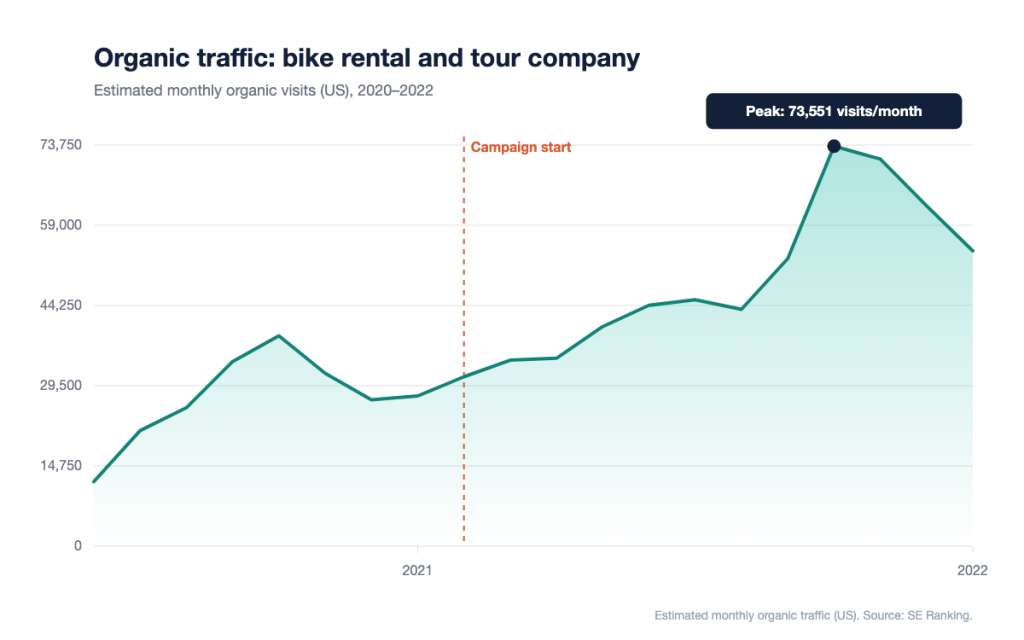
- Traffic: organic traffic peaked at 73,551 visits in October 2021, up 90% on the same month a year earlier. January 2022 was up 97% year on year (54,292 against 27,621).
- Rankings: keywords in Google’s top five grew from 418 to 805, and top-10 keywords grew from 872 to 1,501.
- Value: estimated monthly traffic value rose from about $42,000 to $63,658.
- Client
- Bike rental and tour company (anonymous)
- Industry
- Tourism & Travel
- Services
- Analytics & Tracking, Link Building, SEO
- Timeframe
- February 2021 to early 2022
- How we worked
- White label SEO
- Budget
- $750–$1,000/mo
Led by Harry James, our Managing Director, with 10+ years in digital marketing, team building and leadership.
The white label team behind agencies across Australia
agency partners
client campaigns
deliverables completed
white label reports

Google Partner
We got our first lead from AEO and closed them. It's a great feeling to know the work we're doing has translated to client acquisition so quickly.
Multi-location clients often have hundreds of near-duplicate pages. Getting the keyword mapping, metadata and schema right for every location is detailed work, and it pays off at scale. We deliver it white label.
See how our white label SEO works, or talk to us about a multi-location client.
More case studies like this
Have a client who needs results like these?
Tell us about the client and what they need. We’ll come back with a plan, timelines and wholesale pricing, delivered under your brand.